
Real estate Google Ads
One account: 39.31 conversions in 30 days, up from 30.35.
Get a free account reviewThe Screenshots
One Google Ads overview from each account: Account A for Sep 16 to Oct 15, 2026, and Account B for Oct 1 to 24, 2026. Select either screenshot to see it at full size.
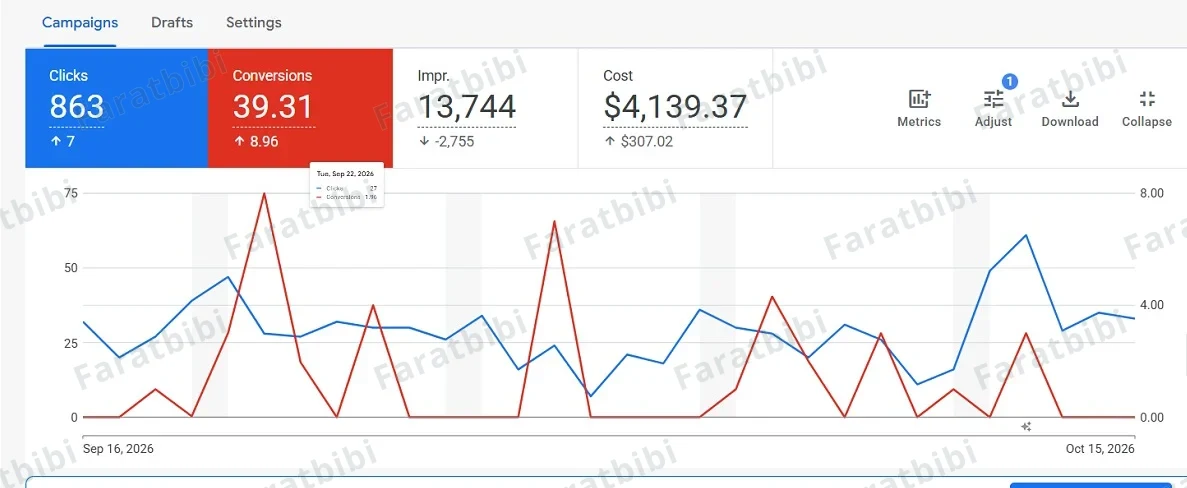
Account A, 30-day view
 Open full size
Account A, Sep 16 to Oct 15, 2026: 863 clicks, 39.31 conversions, 13,744 impressions and $4,139.37 cost, as Google shows them. Google's arrows beneath each figure compare it with the 30 days before: impressions went down, and clicks, conversions and cost went up. Dates as labeled along the bottom of Google's chart.
Google opened a one-day summary over the chart when the pointer rested on it.
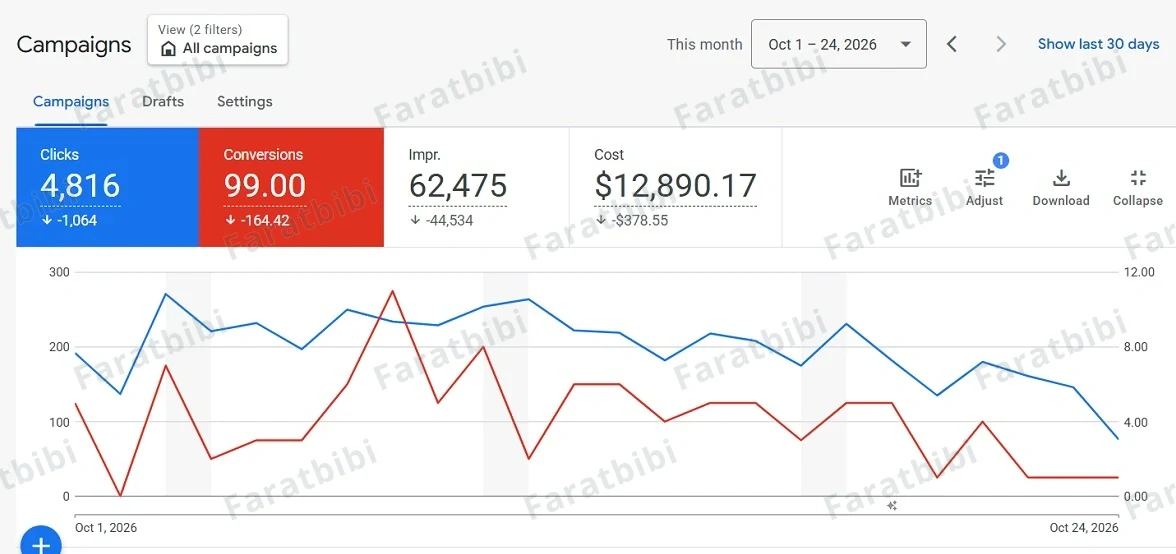
Account B, the largest
 Open full size
Account B, Oct 1 to 24, 2026: 4,816 clicks, 99.00 conversions, 62,475 impressions and $12,890.17 cost, as Google shows them. Against the 24 days before, all four arrows point down: clicks by 1,064, conversions by 164.42, impressions by 44,534 and cost by $378.55. Dates as set in Google's date picker.
The Figures Side by Side
| Period | Clicks | Conversions | Cost | Cost per conversion (calculated) | Conversion rate (calculated) |
|---|---|---|---|---|---|
| Account A, Sep 16 to Oct 15, 2026 | 863 | 39.31 | $4,139.37 | $105.30 | 4.56% |
| Account A (the 30 days before) | 856 | 30.35 | $3,832.35 | $126.27 | 3.55% |
| Account B, Oct 1 to 24, 2026 | 4,816 | 99.00 | $12,890.17 | $130.20 | 2.06% |
| Account B (the 24 days before) | 5,880 | 263.42 | $13,268.72 | $50.37 | 4.48% |
Google's overview does not print the last two columns, so I divided cost by conversions and conversions by clicks, rounding to two decimals. Each row for the days before is the figure above it minus the change its arrow shows.
How I Run Real Estate Accounts
Housing ads on Google come with extra rules, so every point below works inside them.
- Sellers and buyers get separate campaigns. Sellers search "what is my home worth", buyers search "homes for sale in" a neighborhood, and owners who want a fast sale search "we buy houses". Each group the business serves gets its own campaign, ads, landing page and conversion action, with searches for property management or license classes blocked.
- Neighborhood names do the targeting. Each campaign's location is set as a city or a radius, which housing ads are allowed to use. The neighborhoods then come in through the words: subdivision names in keywords, headlines and sitelinks.
- Each campaign gets its own map. Buyer campaigns are set to reach people with "presence or interest" in the area, so someone relocating from another state still sees the ads. Cash-offer campaigns carry a list of excluded places, because "sell my house fast" draws searches from far outside the area you buy in.
- Fair Housing wording, every time. Ads and landing pages describe the house ("fenced yard, updated kitchen"), never who should live in it ("perfect for young families"). Where state rules call for it, the brokerage name sits next to the contact details.
- Seller ads open a valuation page. A seller ad never lands on a listings search page. It goes to a valuation page with homes recently sold nearby, and a short form that asks for the address first and contact details last.
- Appointments count more than sign-ups. Valuation requests, showing requests and calls longer than a set length are the main conversions, while listing sign-ups are watched but kept out of bidding. Where your CRM allows it, booked listing appointments are imported back into Google Ads as well.
What the Numbers Say
Account A's conversions rose 29.52% over 30 days, from 30.35 to 39.31. Cost per conversion fell from $126.27 ($3,832.35 ÷ 30.35) to $105.30 ($4,139.37 ÷ 39.31), while spend went up 8.01%. With 863 clicks against 856, nearly the same traffic turned into more conversions: 4.56% of clicks (39.31 ÷ 863), against 3.55%.
Account B, the largest account on this site, had a hard October. From Oct 1 to 24, 2026, it spent $12,890.17 and recorded 99 conversions, against 263.42 on $13,268.72 in the 24 days before. Spend fell only 2.85%, so each conversion cost $130.20 ($12,890.17 ÷ 99), against $50.37 ($13,268.72 ÷ 263.42).
I keep this dip on the page on purpose. A month like this calls for a fresh look at the search terms, the landing pages and the conversion setup, and an honest report says so. The two accounts may count different actions as conversions, so I read each one against its own earlier days, not against the other.
Conversions here are the actions each account is set up to record, like calls and form inquiries. Where Google splits credit between ads, it shows the count with decimals.
Who This Is For
If It's Your Business
If you list homes, help people buy them or buy houses for cash, I can look over your account for free. I start with where each kind of search ends up and how your conversions are set up, then you decide the next step.
If It's Your Client's Account
When a client of yours works in real estate, I can look after that account's Google Ads on a white-label basis. Ad text is checked for Fair Housing wording before it goes live, and seller, buyer and cash-offer figures stay separate in my updates.
Let's Look at Your Real Estate Ads
Send a few details about your account, or a client's. I'll review it for free and tell you the first change I would make.
Other Industries
- Senior living: the largest account recorded 317 conversions from Oct 1 to 24, at $11.19 each.
- Home & kitchen remodeling: both accounts gained conversions this month, 43 against 33 and 17 against 11.
- Driving instructors: one account doubled its conversions this month, from 17 to 34.